Set the flow and water temperature you actually fish. Riverbot reads the public gauge
every 15 minutes and emails you the moment your window opens — then again when it shuts.
No card. No waitlist. Eight public networks across three continents.
Example · Grand River watershed
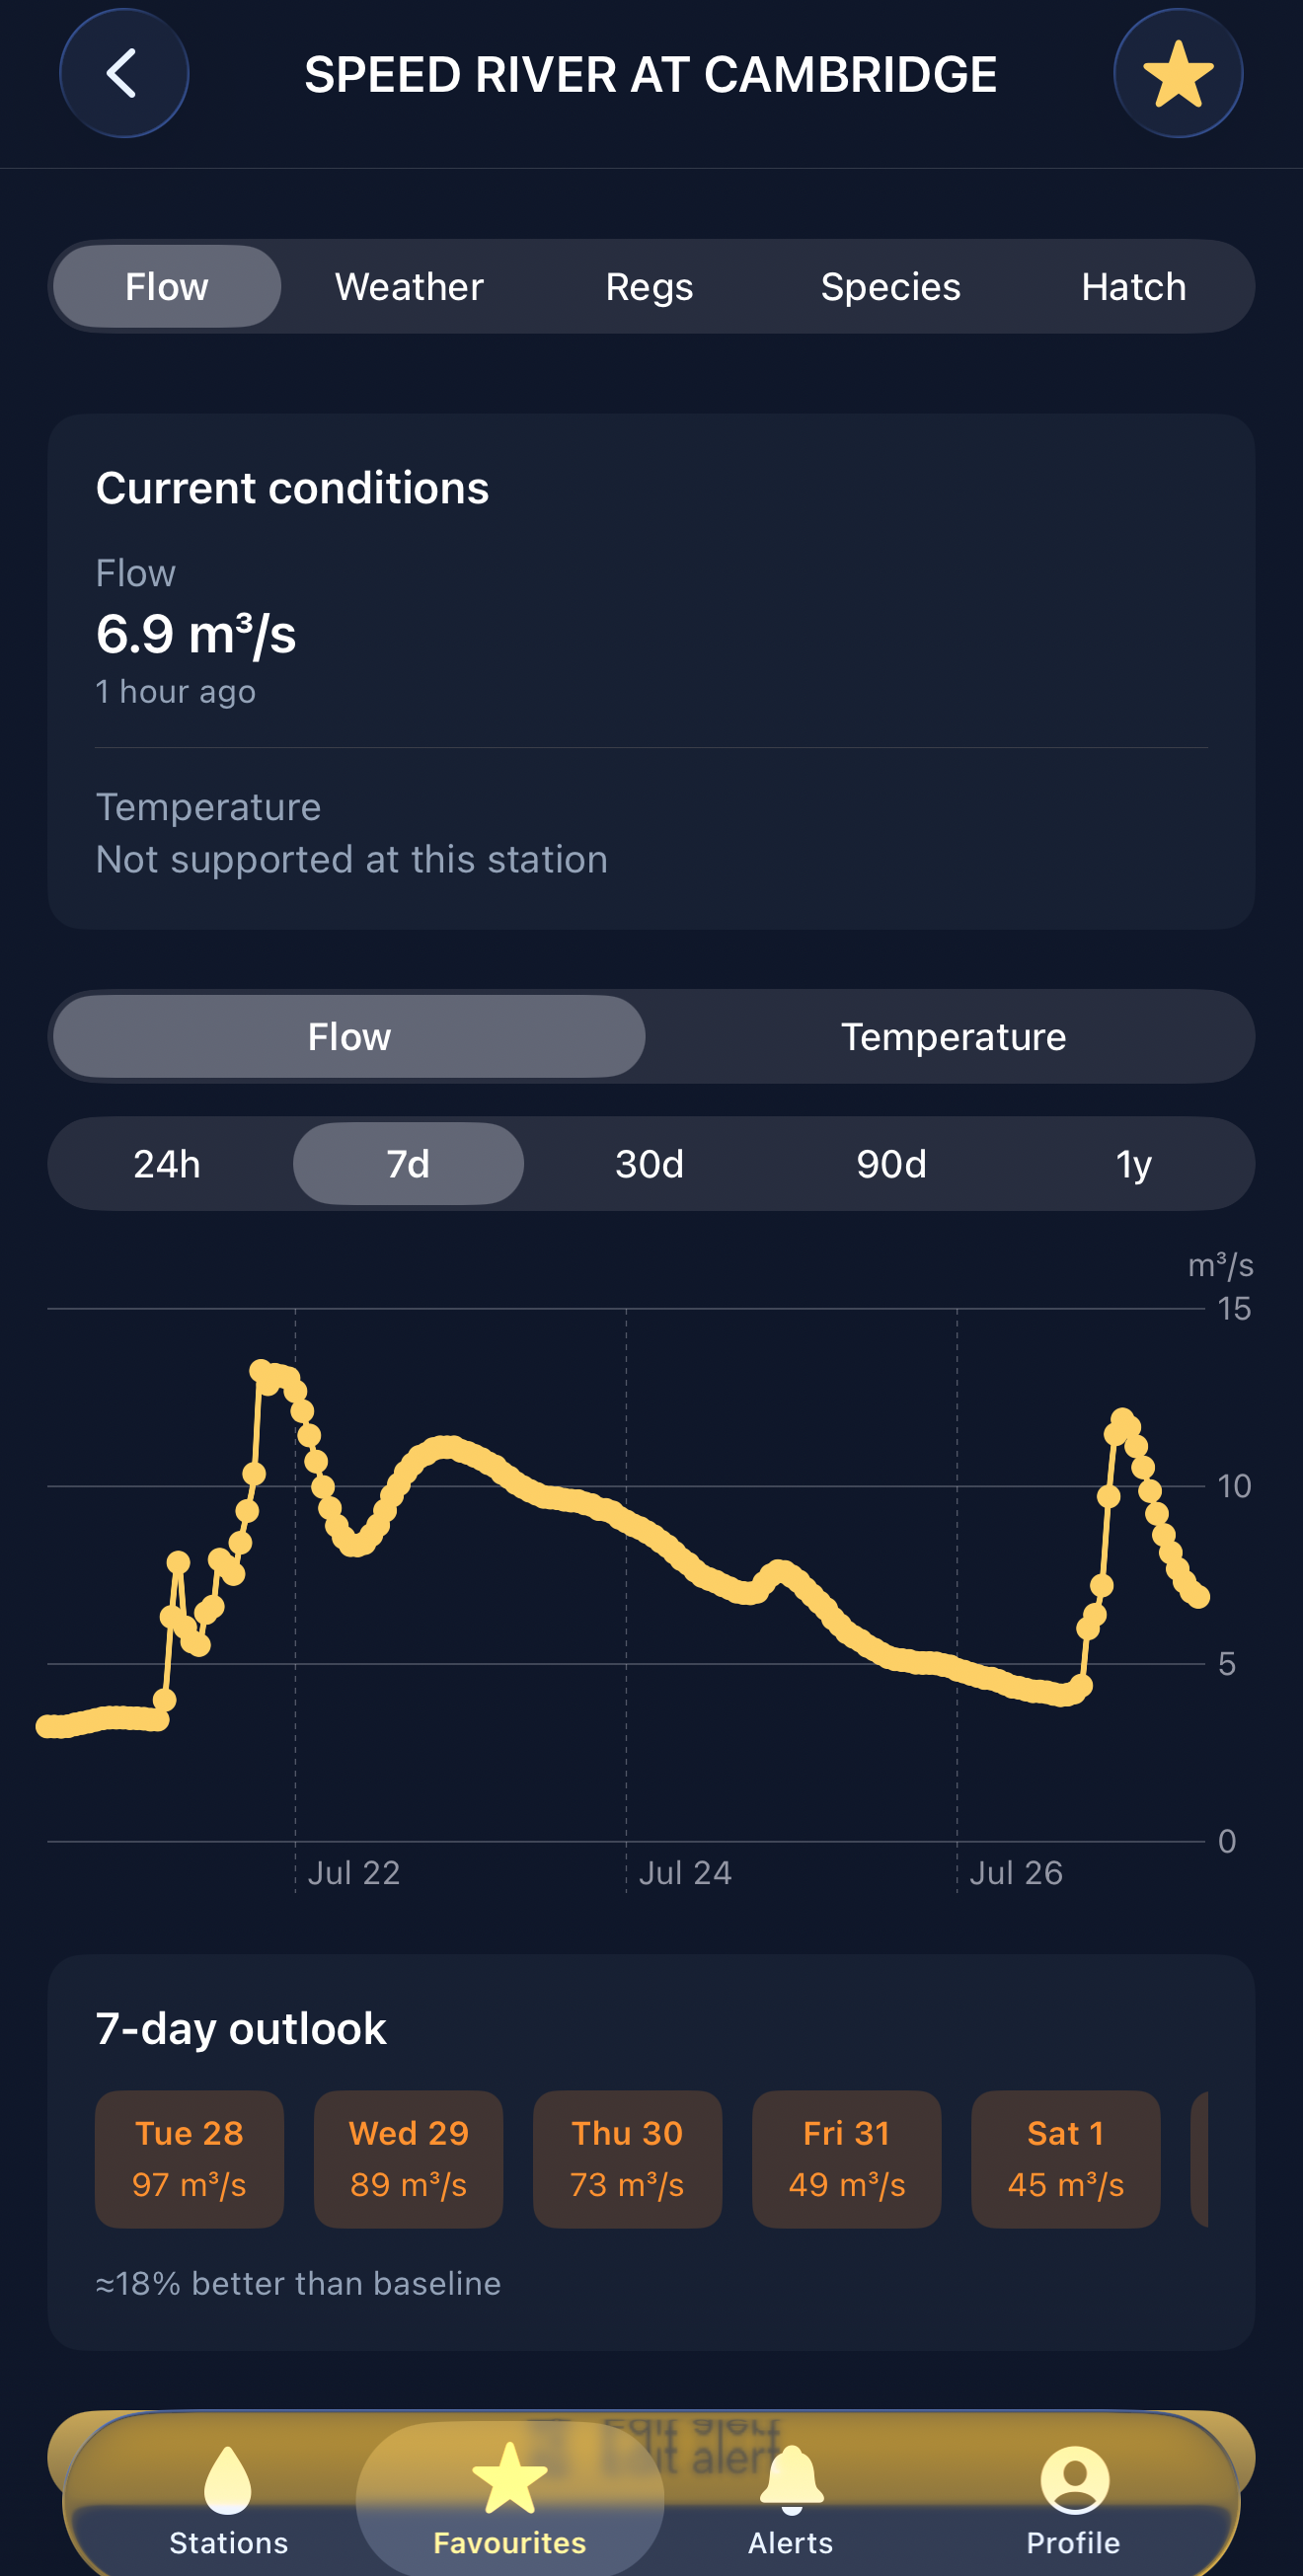
Speed River at Cambridge
In your window
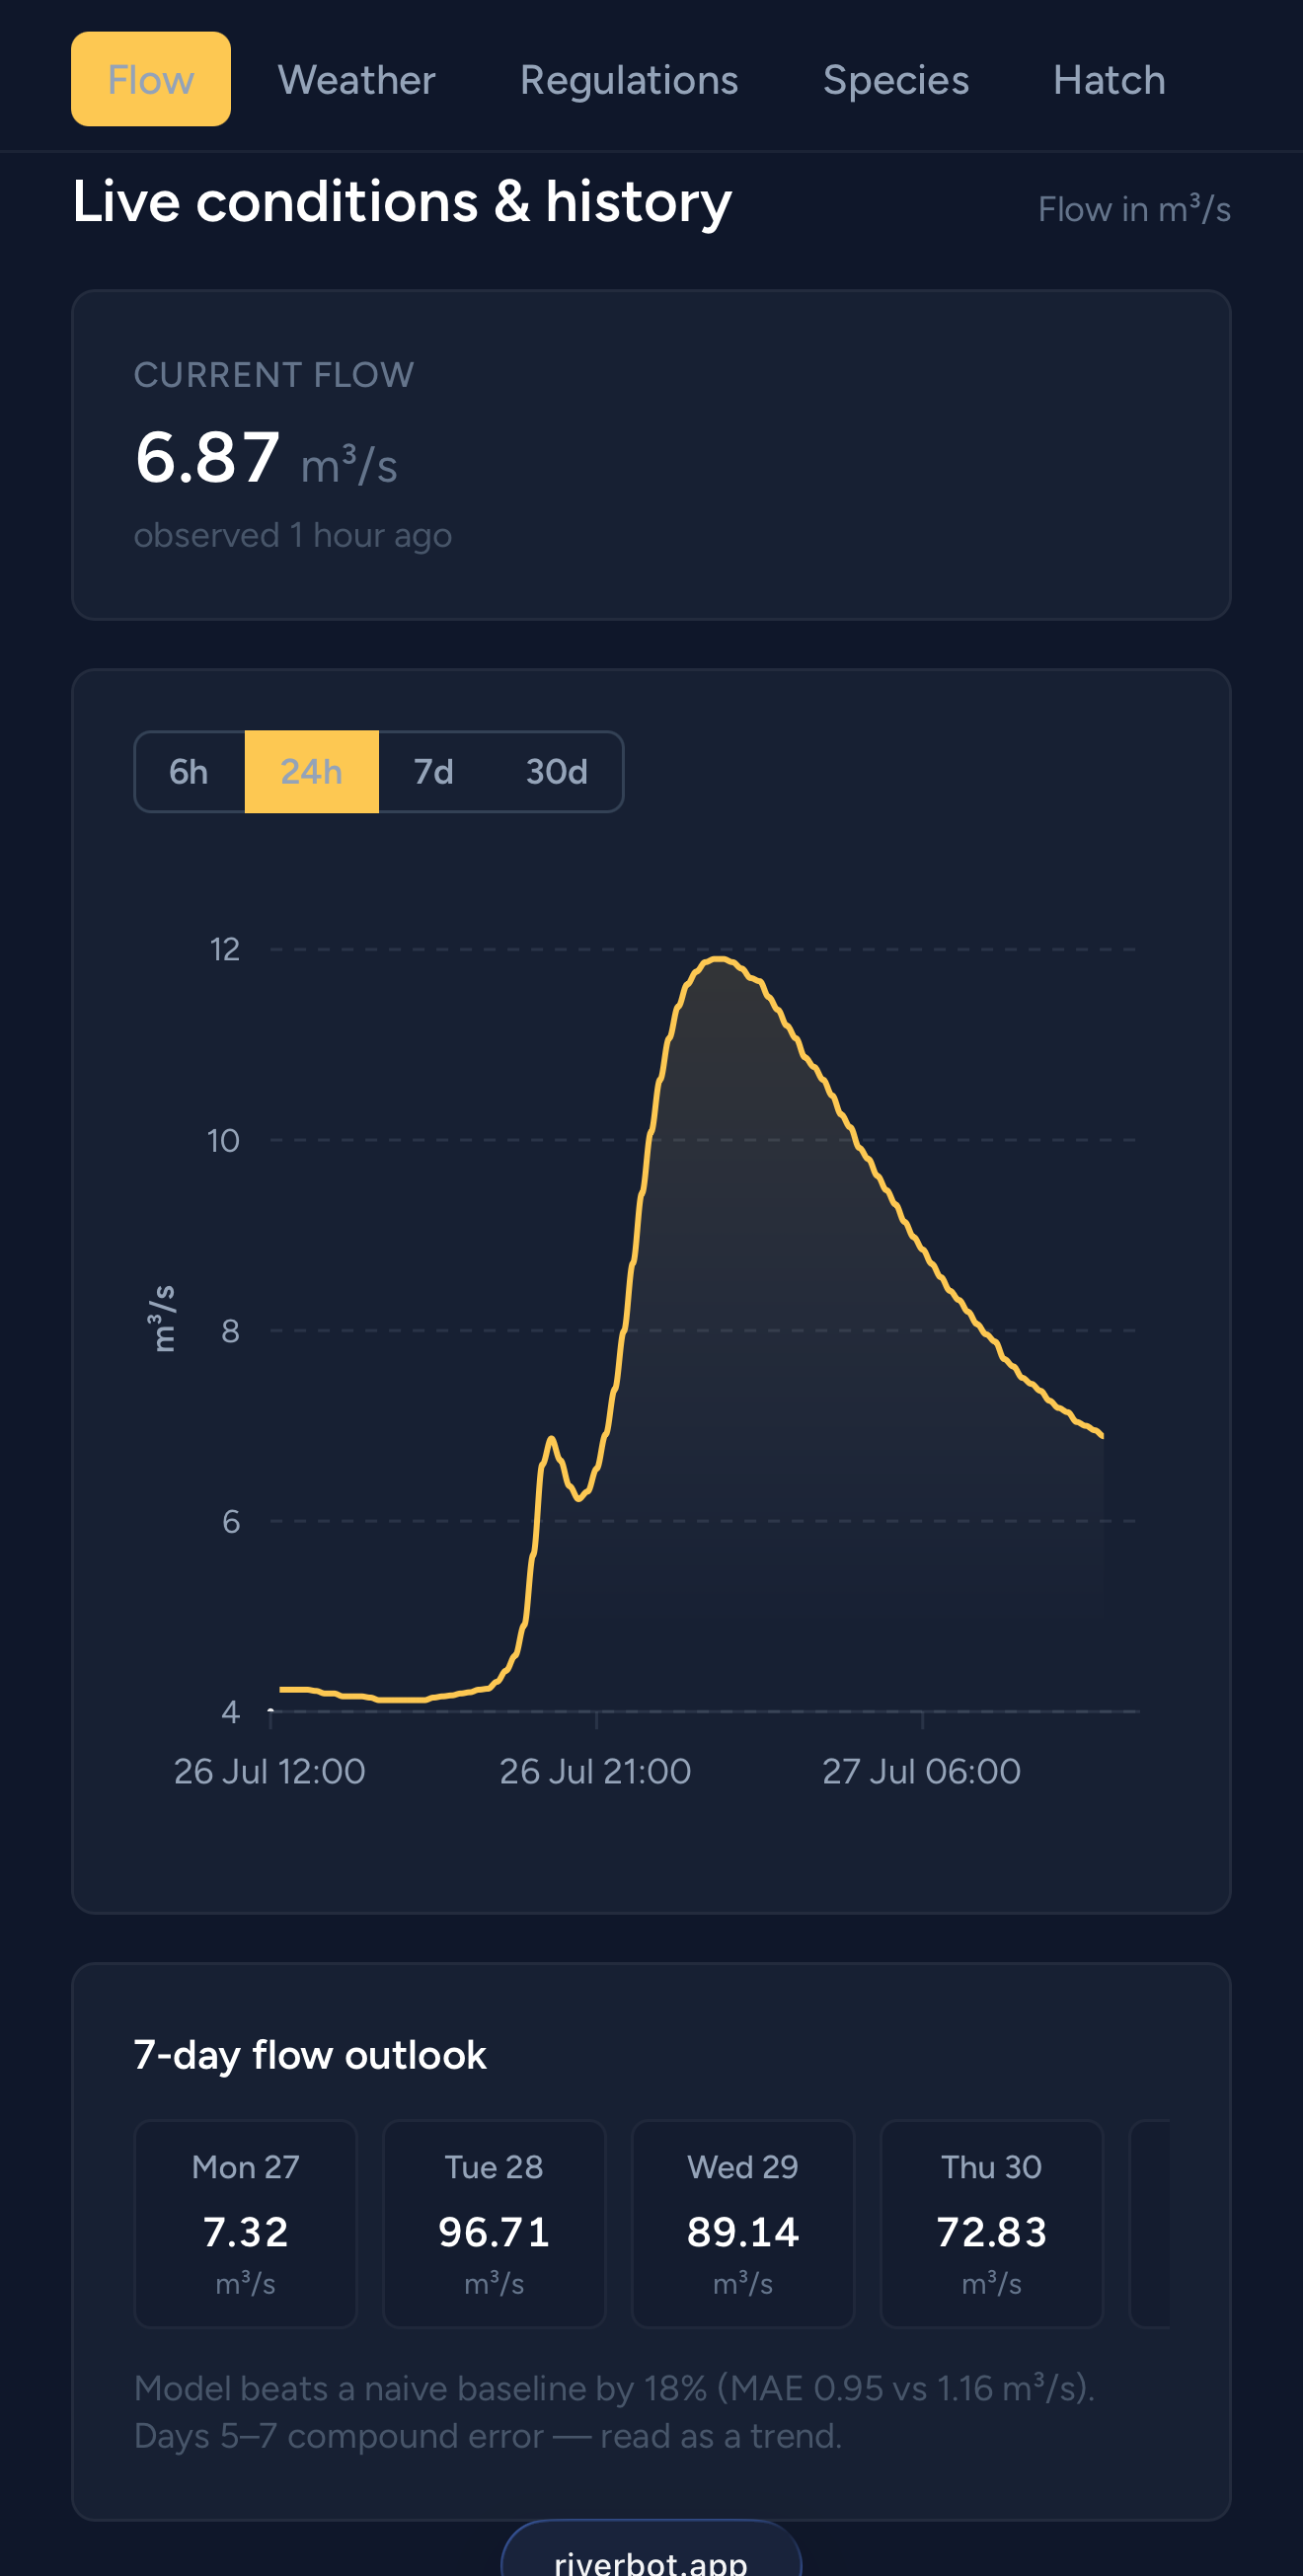
6.9m³/sobserved 1 hour ago
7 days agoyour window: 5–12 m³/snow
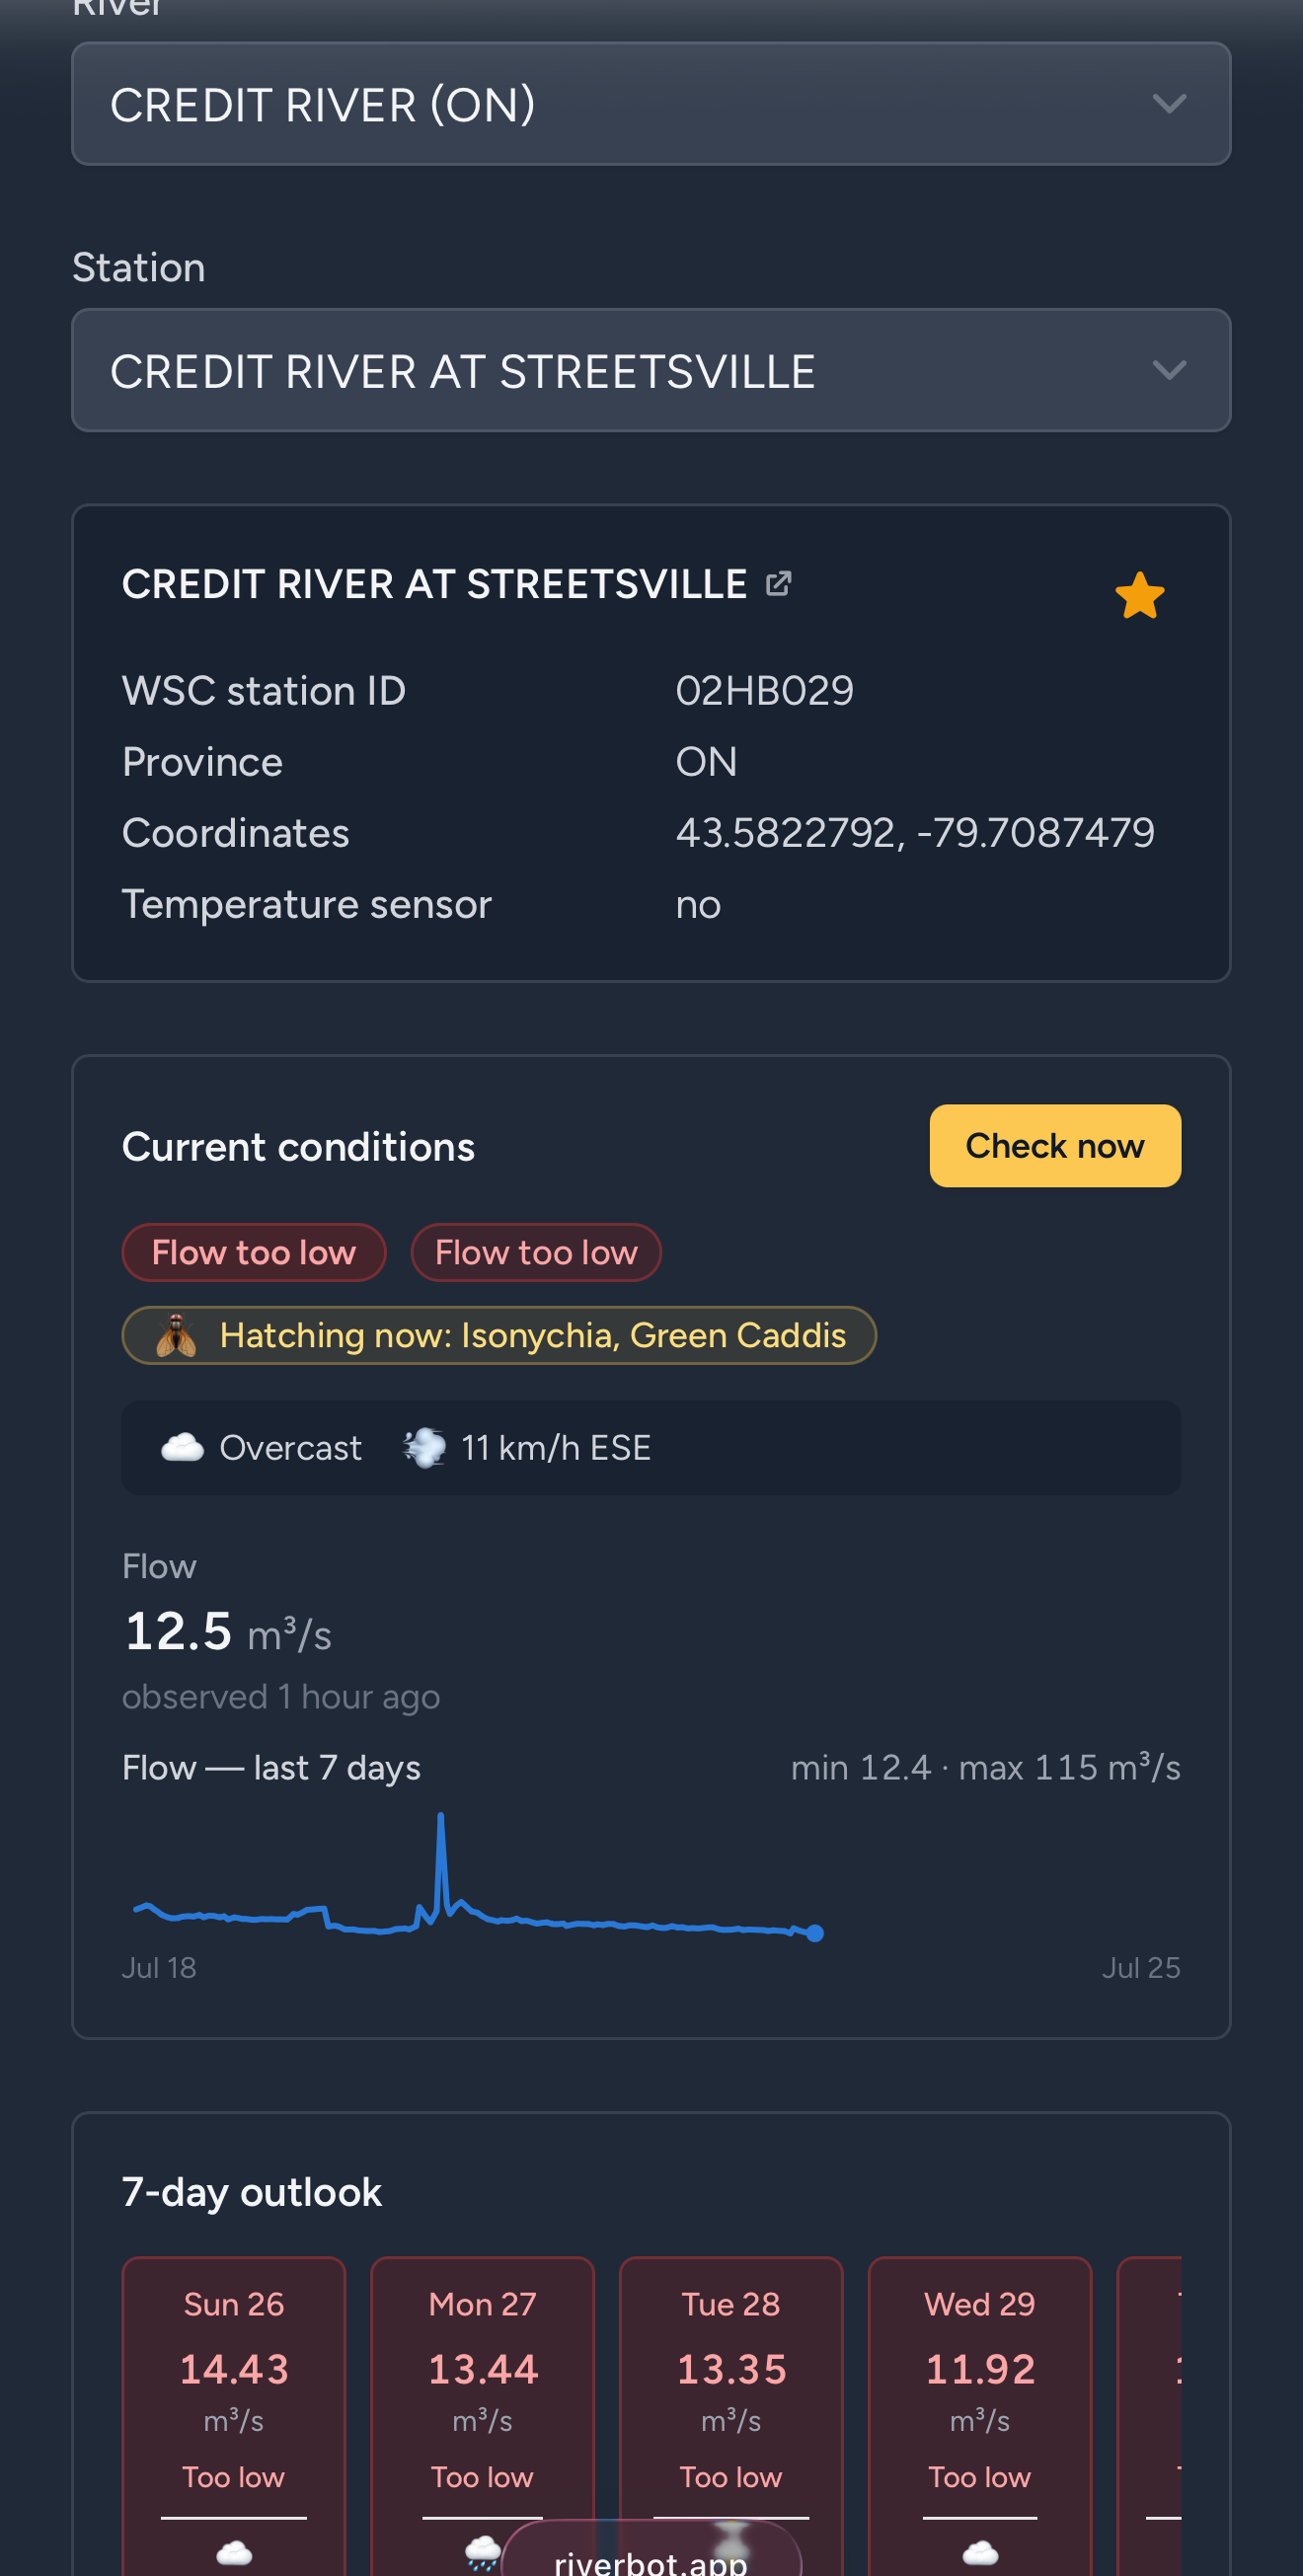
🪰Hatching now — Isonychia, Green Caddis
25,077
live gauges watched
8
public networks, 3 continents
15 min
between readings
1947
earliest history on file
The map
Find the gauge that covers your water.
Every real-time gauge in the network on one map, rivers traced in neon. Stations you've set
thresholds for are coloured by current conditions — green means go. Tap “near me” and it
finds the gauges around you.
Canada, the US, Germany, the UK, Sweden, France, Norway and the Czech Republic.
Water temperature live wherever the sensor exists — USGS, the Grand River, Sweden, Norway, Czechia.
Read in cfs or m³/s; pick once in your profile and every number follows.
Your window
Two numbers. That's the whole setup.
Min and max flow, min and max water temperature, per station. Leave a side blank and it's
unbounded. Then Riverbot only writes to you on a transition — window opens, window closes —
with a cooldown so a river flapping around your threshold doesn't fill your inbox.
7-day outlook, with the error bars
Predicted daily flow for the week, each day flagged against your thresholds. On station
02GA016 the model beats a naive “same as today” baseline by
11% (MAE 2.014 vs 2.261 m³/s) — and says
so, right under the numbers. Days 5–7 compound error; read them as trend.
Weather in the same glance
Sky, wind and rainfall sit beside every forecast day — because 31 km/h NNW decides your
morning as surely as the flow does.
For fly anglers
It knows what's coming off the water.
Hatch calendars from fly shops and guides who actually fish the river: insect, hook size, and
the patterns that work — month by month, all year. On rivers we have data for, sign in and the
station page tells you what's hatching today, next to the flow that decides whether you go.
Search by name or drop a pin on the map. 25,077 real-time gauges, from your home creek to a river you have never fished.
02
Set your window
Min and max flow, min and max temperature. Leave what you do not care about blank.
03
Go fishing
We watch the gauge. You get one email when it opens and one when it closes — nothing in between.
On your phone and your wrist
Available now
Get Riverbot for iPhone and Android — favourites, live flow, charts and the outlook on your phone,
plus an Apple Watch app and watch-face complication. You can also use Riverbot in your browser.
Water level across the whole catalogMore Canadian temperature sensorsStarter thresholds by speciesPredicted hatch dates from water tempWider hatch coverageA heavier forecast modelWater clarity, if a public feed ever appears
Stop refreshing the gauge page.
Pick your river, type two numbers, close the tab. We'll write when it's worth going.